Step 1: The Context Test
For each metric, ask: "How does this connect to a business outcome?" If you can't draw the line, you need more context, not less data.
Too many reports flood your inbox with disconnected numbers. Few show you how those numbers work together to guide decisions.
It’s time to focus on clarity—not clutter—so you can move from data overload to smart decisions.
Most Marketing Reports Show Data. Few Show Connections.
You’re not alone if your current reports are packed with numbers but light on insights about how they work together.
How do your awareness metrics connect to your conversion metrics?
Which combination of channels and touchpoints create your best customers?
Where in your customer journey are the strongest opportunities for improvement?
If your reports treat each metric as a standalone story, you’re missing the bigger picture that drives growth.
Page views and bounce rates aren’t meaningless—they’re incomplete without context. The real question is: how do these connect to your business outcomes?
The best decisions come from understanding how your entire measurement ecosystem works together—from first impression to final sale.
Traffic Volume
On its own, it’s just a number. But when paired with conversion rates, it tells you how efficiently you’re turning interest into revenue.
Bounce Rate
A high bounce rate isn’t always bad—it depends on the page’s purpose. We look at intent, page type, and engagement to make sense of it.
Click-Through Rate (CTR)
A solid CTR can be a good sign—if it leads to the right actions afterward. We track what happens after the click to guide real improvements.
Cost per Qualified Lead (CPQL)
How much you’re paying for leads that are actually a good fit—not just anyone who fills in a form.
Conversion Speed
How quickly someone goes from “interested” to “signed up.” Slow pipelines waste time and money.
Real Returns by Channel
It’s not enough to know clicks or likes. Which platforms actually bring in paying customers?
Engagement Signals That Matter
Time on page means nothing without action. We look at what people do—like scrolling, clicking, and showing intent.
Lifecycle Attribution
Sales often come from a mix of touchpoints. We help you see how each step helps close the deal.
Sign up to our newsletter to better understand your marketing!
The 5-Minute Reporting Audit
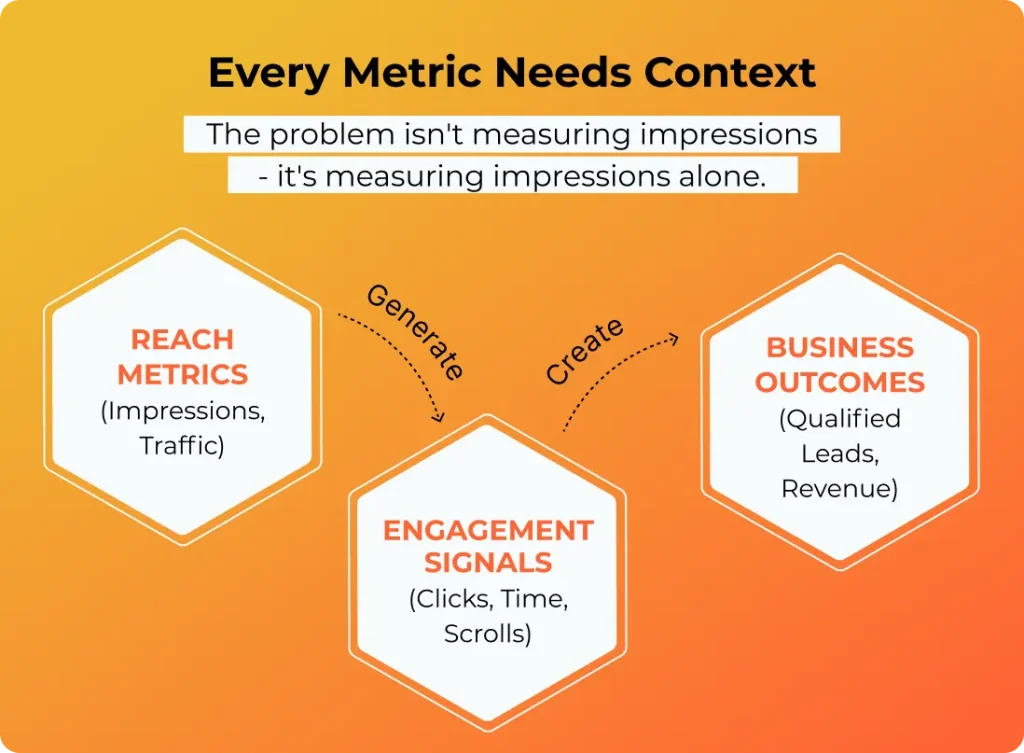
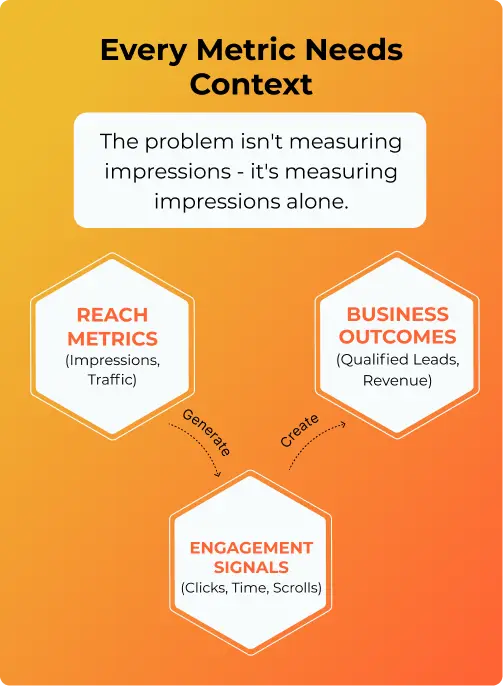
Turn Isolated Data Into Connected Intelligence
For each metric, ask: "How does this connect to a business outcome?" If you can't draw the line, you need more context, not less data.
Map how your metrics connect: Traffic → Engagement → Leads → Sales. Missing links in this chain reveal measurement gaps, not useless metrics.
For each metric, identify: What can I adjust to influence this number? No clear levers = look for the upstream metrics that reveal what you can control.
Can your metrics tell a complete story from awareness to conversion? Gaps in the story = gaps in your measurement.
Rank metrics by their role: Leading indicators (predict future performance) vs. Lagging indicators (measure past results). You need both.